Archaeology // Curation // Exploration

Tuesday, March 08, 2011

In Nietzsche's Shadow:
Cartography, Geohistory and the Changing Nature of Landscape

...you would fancy him a madman when you see him walking along the most devious of paths...seeking for the traces of lost facts in rough woods and thickets...
--Cassiodorus on Roman Surveyors


My current work of searching for the remains of Roman mapping and cartography was born on the ancient paths and trails of Southern France. Hiking through these areas year after year continually brought me face to face with a type of historical research that I think has been missing from what has recently come to pass for the history of cartography. Wandering these paths and old Roman roads makes one consider the relationship that cartography has to landscape and with the kind of geohistory first imagined by members the French Annales School.


The village of Eze from Mont Bastide


The medieval historian Georges Duby said in his autobiography, History Continues, that,

"historians sometimes find much of what they are looking for when they step outside their rooms and look around."

I believe this to be especially true for the historian of cartography. Duby says that,

"What I was looking for in my wanderings through forests and fields was the reassurance of a concrete grasp on reality. The tattered, threadbare fabric that I was trying to mend stitch by stitch with the aid of my Latin texts needed solid support. I wanted to lay it down over a document of a very different kind: one just as rich...but without gaps and preserved not in the darkness of the archives but open to the sunlight and to life itself, namely, the landscape."

Duby talks at length about how,

"no technological revolution had yet radically transformed the agricultural system in my region, and forty years ago the network of paths was still much the same as it had been in the year 1000."

Today some things have changed but many of the old paths and field patterns survive and, as I have shown in my work on Tunisia, can be extremely useful when trying to reconstruct the Roman limits. This is especially true in places like Tunisia and Libya were a great deal survives in the way of field patterns and boundaries, but these same hints in the landscape can also be found in some areas on the continent. My own wanderings along the forgot paths of the moyenne and grande corniche, places like the Friedrich Nietzsche trail, which goes from the Mediterranean Sea up to the village of Eze (shown in the photo above) continuing to the summit of the Mount Bastide, have shown just how enlightening such an approach can be. Nietzsche himself used to walk this particular chemin daily while he was living in Eze, and composing parts of Thus Spake Zarathustra, but the history of the path goes back at least to the iron age. As Nietzsche said in Ecce Homo,

"The following winter [1883-84], under the halcyon skies of Nice, which glistened above me for the first time in my life, I discovered the third part of Zarathustra-and the book was finished. Scarcely a year for the composition of the whole. Many concealed spots and many heights in the landscape of Nice have become sacrosanct to me because of unforgettable moments there. That decisive part of the third book, 'Of Old and New Tablets,' was composed on the difficult and steep ascent from the railway station at Èze to the marvelous Moorish eagle's nest overhead.-My muscle tone was always greatest when my creative energies flowed most abundantly. The body is spirited-let us leave the 'soul' out of play. . . . One could often have spotted me dancing: at that time I could wander through the mountains for seven or eight hours at a time without tiring. I slept well. I laughed a lot-I was fit as I could be, and I was patient."

Along the trail one finds the remains of a large bastide or oppidum whose occupation dates back to neolithic times but that was also occupied and rebuilt by the Romans during the Julian-Claudian period. Many of the walls and some of the roads are still intact, as shown in the photo above. Ruins of this type, with parts of the road structure remaining, are useful in reconstructing how and where the Romans actually surveyed and mapped. Boundary stones and mile markers have also been found in this region and lend further help in producing accurate reconstructions of the type that I am engaged in.


Most of the theoretical foundation for these types of researches stem from the work of Fernand Braudel (1902-1985) and Marc Bloch (1866-1944), two of the founders of the Annales School. Braudelian landscape and geohistory can be reduced to a few basic assumptions.

1. geohistory has a specific concrete object that is 'tied to the soil', to elemental ecological conditions...to the landscape and its historical modifications.
2. geohistorical process, because it develops so slowly, represents a relatively immobile history, whose characteristic patterns last for long periods, things like field patterns, paths and roads.
3. geohistory is fundamental to other kinds of historical process and underlies other forms of historiocity.


Braudel wrote that within the bonds of his technological capacity man is free to do what he will with the landscape in which he dwells. A very interesting Heideggarian parrallel could be written here using Heidegger's essay Building, Dwelling, Thinking but I will not go into that now.

According to Braudel, the very formative capacity of the human endeavor, the ability to bend the landscape and change it in ways that last beyond single human lifetimes, creates constraints that become determinants of later human history because they are relatively 'fixed' or 'permanent'. Hence paths and field patterns last much longer and have their origins in many places in the remote past. These things become fixed and although we do not recognize them at first sight, old paths and field patterns can tell us a great deal about the history of an area and can open up new areas of physical research that help in our cartographic researches.

One look at Marc Bloch's French Rural History will give some insight into what I am getting at here. Bloch's essay is very important for a number of reasons that are methodologically interesting for this particular project. Bloch, in this short book (it is only 200 pages long), is concerned ironically with a long span of time, beginning in the 13th century and ending in the early 18th century. His conception of rural history is broad, taking into account not only farming techniques, but customs and the development of social norms. What was for the time most revolutionary however, was Bloch's systematic use of non-documentary sources like estate maps and the layout of the physical environment itself.

French Rural History came to my attention because of it's use of the so-called 'regressive method'. Bloch read history backwards on the grounds that we know more about later periods and that it makes logical sense to proceed from the known to the unknown. There were others before him who used this method like the English historian Frederick Seebohm who, in 1883, published The English Village Community. The book begins with an important chapter entitled, 'The English Open Field System Examined in its Modern Remains". Seebohm uses the surviving clues in the landscape to work backwards to the foundations of early English village life much in the same way as Bloch does with his maps of remaining field patterns in France and as I am trying to do with Roman Surveying. More modern studies, like Alan Baker's, Studies of Field systems in the British Isles give one some sense of what the historian can achieve if one simply gets outside. All of this of course requires a certain rethinking of how we write and conceptualize cartographic history as something that as George Duby said, "is open to the sunshine".

Wednesday, December 15, 2010

Getting into Shape:
What Do Butterfly Wings and Renaissance Maps Have in Common?

---
A Note on Method
---
There are spaces in which the determination of position requires not a finite number, but either an endless series or a continuous manifold of determinations of quantity. Such manifolds are, for example, the possible determinations of a function for a given region, the possible shapes of a figure, and so on.
--Bernhard Riemann

The comparison of the accuracy and geometric outline of an early map with a modern map is really just the calculation of the change in shape of two planar surfaces. It is a coordinate transformation that can be as complex or as simple as one likes. My interest in the mathematics of shape change came about while I was working in the Entomology Department of the Smithsonian Institution’s National Museum of Natural History.

I was first specifically interested in trying to quantify the variation in the shape of butterfly wing patterns. At first, my interest was centered on the genus Erebia from the Alps of France. Erebia are high mountain butterflies that speciated a great deal during the last large scale glaciations that drove them out of the valleys and isolated them on peaks throughout the Alps. The amazing complexity of their spatial distribution is not well understood. Some of the variation between species can be quanitifed by looking at the shape variation in their eyespots and the surrounding color bands on both pairs of wings.


Later, I worked, with Marc Epstein at the Smithsonian, on a group of moths where I became interested in one species known as Euclea Delphini. Within this species we find a great deal of variation in the wing patterns. In the case of Delphini there are five different forms that are not totally discrete but tend to make-up a pseudo-continuum. In order to study this with some meaningful statistics it is necessary to describe the shape of the features that are varying mathematically. These features take a variety of forms from lines and polygons through more complex curved concave and convex shapes.

There are no natural measures associated with the two-dimensional variation of these features in the wings of butterflies so what to measure becomes a problem. Nijhout’s(1) work in this area was very helpful in trying to define what the basic elements of wing patterns were and in helping to narrow down what parts of the patterns are varying in a meaningful way. (http://www.biology.duke.edu/nijhout/images/PatternElements.pdf) I began experimenting with some simple morphometric models and was naturally led to the work done on shape spaces by David Kendall and Fred Bookstein. The studies of shape spaces that they pioneered are very interesting and are themselves objects of mathematical research. It is not always useful to think of shapes as collections of points in Euclidean space. Shape is something that has a spatial structure that is quite peculiar and generally these spaces and subspaces do not occur in other contexts. Huiling Le and Kendall(2) wrote a beautiful paper on this entitled, “The Riemannian Structure of Euclidean Shape Spaces: A Novel Environment for Statistics” that shows that these spaces have a local Riemannian structure. I immediately became fascinated with these spaces and read more deeply than the application to the problem of butterfly wings suggested. The structure of these spaces is complex and unfortunately I still do not think that I have a good grasp of all of Kendall’s work. The key point here is that there exists a well defined mathematical machinery that lets us apply non-linear transformations to these spaces while maintaining some meaningful definitions of physical distance.

Wing Patterns or Coastlines?

Modeling the shape change on a modern and ancient map is not all that different from the butterfly wing problem, but it does vary in a number of ways. For example, when working with two maps, we do not have a large sample of objects that we are comparing. We are not looking for clusters or variations that seem to group themselves together in statistically meaningful ways. We really are comparing two discrete objects with the hope of quantifying an ill-defined concept that we call accuracy. The question of accuracy in historical cartometric studies is, at least according to the J.B Harley (3) , one of the least understood problems in the history of cartography and it is especially difficult to quantify.

Fortunately morphometrics does have a great deal to tell us about how to begin to study this problem of comparative accuracy. For instance in both cases we are still operating on sets of homologies. Homologies are points, locations or landmarks that are the same on the objects of interest. They could be the location of a particular structure on a butterfly’s wing or the location of Rome on two maps from different historical periods. In historical cartometry we select a set of these points and then transform one set of points into the other using any number of possible algebraic or differential transformations. We are performing a type of image warping which maps all the selected positions in one image plane (the modern map) to the positions in a second plane (the ancient map). The choice of the mathematical function that actually performs the “warp” is always a compromise between insisting that the distortion is smooth and achieving a good match between the two sets of points. There are and have been many approaches to this.

One of the earliest applications of this type of coordinate transform or “warp” to maps came from Waldo Tobler (4) who experimented with them back in the 1970’s. Any discussion of the applications of complex transformations to cartography must begin with his seminal paper and computer program, “Bi-dimensional Regression”. Bi-dimensional Regression was a statistical regression technique that allowed inferences to be made between two planes from point distributions. Tobler studied medieval maps and Portolan charts but was also interested in general questions of shape and was heavily influenced by D’Arcy Thompson’s early studies on deformations found in his book On Growth and Form. Although Tobler’s work was graphically somewhat primitive, the numerical results from his regressions gave the first look at what types of information it might be possible to add to historical studies of early maps through the use analytical comparisons. Tobler’s methods were formalized to shape spaces by Small in several important papers such as “Techniques of Shape Analysis on Sets of Points. (5)

A weakness in Tobler’s methods was the question of error distribution (6) and what have become known as outliers. Outliers are points formed from pairs of homologies that when transformed produce an error that is significantly larger than the other points in the sample. These points if not identified and somehow accounted for in the calculations can destabilize many transformations and can effect correlations and regressions in adverse ways. Hampel and Huber (7) have developed an entire field of study around this problem that has become known as Robust Estimation. The family of estimators that they developed and that are known as M-estimators have been widely used and have even found their way into specialty software programs used in historical cartometry such as MAPANALYST. Intuitively, these estimators allow the control of how much influence on the regressions distant points have on nearby points. One can imagine this as an application of Tobler’s first law of geography, “everything is related to everything else, but near things are more related than distant things”.

My current research derives from the work of Bookstein (8) and his groundbreaking paper, “ Principal Warps: Thin-Plate Splines and the Decomposition of Deformations” (see link section to view this paper). Bookstein uses a particular distance function that defines a convex surface between homologies and that is a solution to the biharmonic equation.
Through some very interesting algebra Bookstein derives functions that effectively separate the global and local error into affine and nonlinear components. The functions are vector valued and if the pairing of the points that are being transformed correspond to the homologies on our two maps we have effectively modeled the difference between the two point sets as a deformation.

At the foundation of Bookstein's method is the function shown above which corresponds to a portion of the surface,


---
---
---
where r is the distance from the origin. The U(r) function satisfies,


---
and is the solution to the so-called biharmonic equation. We can imagine this surface as a piece of metal that is subject to deformations resulting from the displacements of fixed points on a reference surface. In this case we are comparing points on a modern map and the same corresponding points on an older or different map of the same region. For a thin plate of this type subject to bending, the energy change at any point minimizes,

.

---
If we pick a group of points on the reference map we can place them on the spline grid as shown below.


---
The corresponding points on the map to be studied can then be transformed yielding a deformation grid that minimizes the energy necessary for the deformation. This deformation has both global and local components that allow us to look at the induced error from different scales and is equivalent to the well known measure of cartographic error, Tissot’s indicatrix. The information from these deformations can be used to generate scale isolines as below or vector displacements resembling the indicatrix.

Thus far I have utilized this thin-plate spline method on many maps and in a study that compares the longitudinal error in the Mediterranean basin on the 1507 and 1516 World Maps by Martin Waldseemüller. The method does have significant advantages over methods such as Polynomial Warping that I used in my study, “Warping Waldseemüller: A Phenomenological and Computational Study of the 1507 World Map” (9).

I have since utilized these methods on Roman and some Medieval cartography, like Portolan charts. Using these methods one can calculate distortion grids and scale and rotation isolines.


For the historian of cartography comparing the accuracy on a modern and early map has a number of formal and logical difficulties that must be considered before the application of any cartometric process.


1. The identification of tie points on the two maps to be compared is sometimes difficult and once selected are seldom distributed evenly across the surface of the two images. The problem is essentially one of homology. Finding homologous points on two maps may seem trivial but differences in landmark or coastline shape, an incorrect assignment of place names and changing scales require insight into the target image. The selection of points is especially important when using the simplest linear models without M-estimators where results can be error distribution sensitive.

2. The accuracy and error to be tested and compared may not be a relevant concept across the whole surface of the map. Accuracy is seldom evenly distributed especially in the case of maps of small scale that may be composed from a variety of sources. Discontinuities in error from scale changes are not only scalar but are vector quantities whose direction is important to determine. Rapid changes in accuracy across map surfaces may be difficult to handle with simple linear models and are better approached using local non-linear radial basis functions whose correlations may be statistically more relevant, but mathematically more complex to program. Decisions regarding the use of local or global methods cannot usually be made ahead of time and require experimentation in order to characterize the accuracy and decide on a methodology.

3. The substrate that the map is draw or printed on may have undergone distortion through shrinking, folding, or stretching. Distortion of this sort is especially important to consider in the case of environmentally sensitive materials such as vellum. The distortion of the medium not only effects the accuracy of statistical transformations that we are trying to perform but can also obscure the intent of the cartographer.


4. Spatial association does not necessarily imply causality. The warps and correlations that we calculate using cartometric techniques give real mathematical results but these may be extremely difficult to link to any historical meaning, event or cause. Care must be taken not to over interpret the results of these calculations and not to override historical and documentary context in the rush towards accuracy measures.

5. Historical cartometry is a problem in equifinality or process convergence. Similar types of distortion may arise from different causes making it difficult to derive exact causes for particular distortion patterns.


6. Experimentation is necessary and we must be prepared to use a variety of techniques to characterize the accuracy on a single map.

Considering the qualifications in the application of cartometric methods to historical materials it is obvious that we cannot hope to achieve exact “truth” using our methods or an absolute visualization and characterization of accuracy(10). Instead we assign meaningful notions of probability and statistical measures that are useful for historical comparisons. The analysis of accuracy is an important part of the historical characterization of early maps but the assignment of the adjectives, “accurate” or “inaccurate”, needs to be made more precise in our discourse. The addition of statements like “to this level of confidence by this method” to our use of these adjectives would go a long way to making the results of our calculations repeatable by others engaged in the same research. This more analytic understanding of accuracy requires a much more careful linguistic and conceptual use of these ideas than has been the norm in the historical literature.
Currently there are more algorithms being developed that will be useful for cartographic historians as the fields of medical imaging and shape analysis continue to provide fertile ground for the growth these mathematical techniques. There are many more ways to represent shapes on manifolds and to perform the types of similarity and coordinate transforms than we have discussed here and no doubt more applications shall be forthcoming. The areas of Stochastic Geometry(11) and Poisson Processes in Euclidean space are especially interesting (12).
In the end the researcher who would employ these methods needs to critically consider each map to be studied on a case-by-case basis and would be wise to consider the words of R.A. Skelton, which although written in a different context, can be used as model for the cautions we must recognize in historical cartometry.
---
“The content of the map, as a whole, cannot be assigned confidently to a single phase or horizon of geographical knowledge. Its outlines are in part transcribed from a map prototype or prototypes not precisely identifiable with any extant work; in part they illustrate texts, not all of which have come down to us. The information taken by the author of the map from these sources (graphical and textual) relates to events and concepts of various periods; most of it older by a least a century, and some of it much more, than the presumed date at which the existing map… was made. The delineations in the map before us are separated by long intervals of time not only from the original experience that they reflect, but also from the direct records of it. For the mapmaker was working always at one remove, sometimes (we cannot doubt) at two or more removes, from firsthand records; and it is evident that, to a degree and in senses which it is difficult for us to divine, he exercised his judgment in selection from and in adaptation of his sources, which are themselves partly unknown to us. (13)
---
(1)H.F. Nijhout, “Elements of Butterfly Wing Patterns,” Journal of Experimental Zoology 29 (2001): 213-225.
---
(2)Huiling Le and David Kendall, “The Riemann Structure of Euclidean Shape Spaces: A Novel Environment for Statistics,” Annals of Statistics 21 (1993): 1225-1271

(3) Brian Harley, “Concepts in the History of Cartography: A Review and Perspective,” Cartographica 17 (1980): 54.
---
(4)Waldo Tobler’s papers on the development, theory and applications of bi-dimensional regression include, “Computation of the Correspondence of Geographical Patterns”, Papers of the Regional Science Association 15 (1965): 131-39; “Medieval Distortions: The Projections of Ancient Maps”, Annals of Association of American Geographers 56 (1966): 351-61; “Bi-dimensional Regression”, reprinted in Geographical Analysis 26 (1994): 187-212.

(5) C.G. Small, “Techniques of Shape Analysis on Sets of Points,” International Statistical Review 56 (1988): 243-257.

(6) Tomoki Nakaya, “Statistical Inferences in Bi-dimensional Regression Models,” Geographical Analysis 29 (1997): 169-185.

(7)P.J. Huber, “Robust Estimation of a Location Parameter,” Annals of Mathematical Statistics 35 (1964): 73-101 and Robust Statistics (New York: John Wiley, 1981) see also F. Hampel, Contributions to the Theory of Robust Estimation, PhD Thesis (Berkeley: University of California, 1968).

(8) Fred Bookstein, “Principal Warps: Thin-Plate Splines and the Decomposition of Deformations”, IEEE Transactions on Pattern Analysis and Machine Intelligence 11 (1989): 567-585 and Christopher G. Small, The Statistical Theory of Shape (Berlin: Springer-Verlag, 1996) 110
---
(9)John Hessler, “Warping Waldseemüller: A Phenomenological and Computational Study of the 1507 World Map,” Cartographica 41 (2006): 101-113.

(10) Timothy R. Wallace and Charles van der Hanvel, “Truth and Accountability in Geographic and Historical Visualizations”, Cartographic Journal 42 (2005): 173-181.

(11) A. Braddeley, “Stochastic Geometry: an introduction and reading list,” International Statistical Review 50 (1982): 179-193.
---
(12) F. Morgan, Geometric Measure Theory: An Introduction (Boston: Academic Press, 1988).
---
(13)R.A. Skelton et. al., The Vinland Map and the Tartar Relation (New Haven, CT: Yale University Press, 1965) :228.

Thursday, July 15, 2010

Infinite Geometries:
Mathematical Notes on Werner's Commentary on Ptolemy's First Book and the Projection of the 1507 World Map by Martin Waldseemuller
----
A representation is made with a purpose or a goal in mind, governed by criteria of adequacy pertaining to that goal, which guide its means, medium and selectivity. Hence there is even in those cases no general valid inference from what the representation is like to what the represented is like overall.
--Bas Van Fraassen, Scientific Representation
------
The most naive view of representation might perhaps be put something like this: "A represents B if and only if A appreciably resembles B." Vestiges of this view, with assorted refinements, persist in most writing on representation. Yet more error could hardly be compressed into so short a formula.
--Nelson Goodman, Languages of Art: An Approach to the Theory of Symbols

Among the many technical and theoretical problems that Waldseemüller faced in the construction of his 1507 representation of the world, one of the least trivial mathematically and geometrically was the problem of projection. Dealing with a greatly enlarged earth, compared with the Ptolemaic models at his disposal, Waldseemüller modified Ptolemy’s second conic projection in a way that unfortunately distorted the shape of the new continents because they were forced to the far western portion of the map and hence greatly elongated.

During Waldseemüller’s time, new ideas were rapidly developing out of the theoretical discussions in Book I of Ptolemy’s Geographiae. Many commentators and cartographers realized that there was no reason to adhere to Ptolemy’s restriction of a correct representation of distances on three parallels, a restriction that was introduced in order to construct circular meridians. They found that by altering this arbitrary restriction on the form of the meridians and by applying Ptolemy’s methodology to any number of equidistant parallels, one could obtain a map correct on all parallels, with the meridians easily constructible as curves or polygons, connecting points of equal longitude.

This type of generalization was used on Ptolemy’s second conic projection by Waldseemüller to extend his world map, although not smoothly, as can be seen from the abruptness of the change in the meridians at the equator. A more continuous extension of the second conic projection was made in a less ad hoc way by Bernardus Sylvanus in a world map contained in his 1511 Claudii Ptholemaei Alexandrini liber geographiae cum tabulis universali fugura et cum additione locorum quae a recentioribus reperta sunt diligenti cura emendatus et impressus. Sylvanus’s generalization of Ptolemy’s mapping represented an extension of the area of the globe to between –40 and +80 degrees in latitude and between 70 degrees west and 290 degrees east in latitude using undistorted parallels.

In 1514, Johannes Werner produced his translation and commentary of Book I of Ptolemy’s Geographiae. Werner added to his translation a theoretical discussion of two generalizations of Ptolemy’s second conic projection in a section of his book entitled Libellus de quator terrarum orbis in plano figurationibus ab codem Ianne Verneo nouissime compertis et enarratis. In Werner’s Propositio IV (see figure below) he modified Ptolemy’s methodology by requiring that lengths be preserved on all parallels, represented by concentric arcs, and on all radii. He further modified the projection in a way that made the North Pole the center of what in modern language would be called a system of polar coordinates. In Propositio V, he also required that a quadrant of the equator have the same length as the radius between a pole and the equator.The modifications of Sylvanus and of Werner were the first solutions to the problem of representing the surface of a sphere within a finite area. Waldseemüller’s projection can be graphically approximated using the transformation equations that also can be used to represent an infinite series of projections that include Sylvanus’s, Werner’s and the later Bonne projection.


The value for the central parallel and an additive parameter can be changed in the equations for the Bonne Projection in such a way that an approximation to Waldseemüller’s projections results. The Sylvanus, Werner and Bonne projection in polar coordinates all contain an arbitrary parameter f > 0 such that r = + f. The image of the North Pole accordingly lies on the central meridian at a distance f below the center of the parallels. In the Bonne projection f is assigned in a way that the radii touch the meridian curves always on a given parallel. Sylvanus unknowingly uses a similar value to Bonne, f = 10, and if we assign f = 0 we arrive at Werner’s projection. These of modifications result in the possibility of an infinte series of projections of the Waldseemuller type. This can be visualized by just a few examples from my models of Werner's projection below.


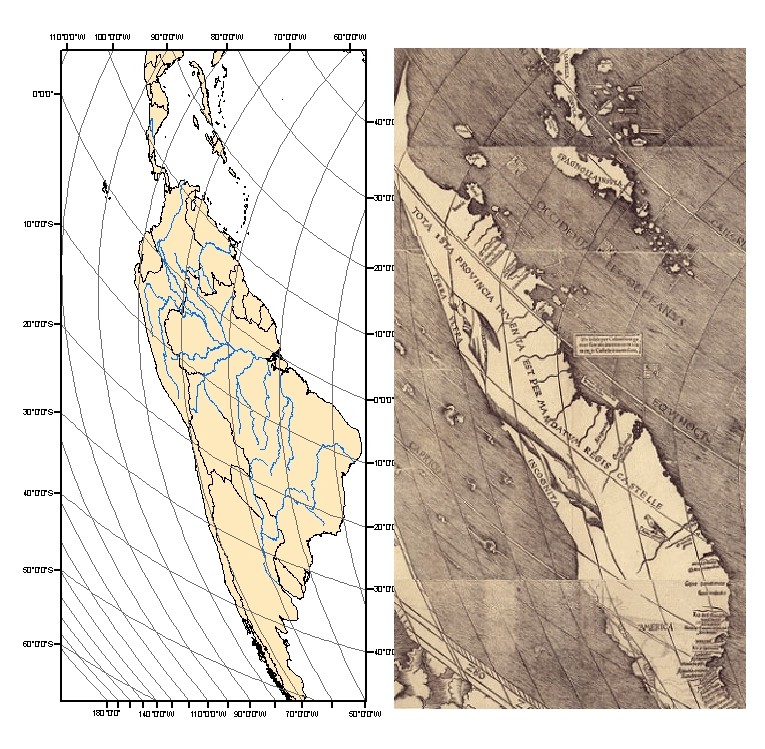
Waldseemüller’s map can be approximated in this same way using values of f between 7-8.5. The actual projection of the 1507 map differs from that represented in the above equations in that it has bends in the meridians at the equator, and the meridians are shown as segmented circular arcs rather than as continually changing curves. This difference is however trivial in the overall look of the projection and the distortions that is produces in the continents of the New World. Using these models the modern coast of South America has been projected in the figure below alongside the same region from the Waldseemüller map.


It can be observed that on the Waldseemüller map that the western coast of South America is portrayed by a series of linear features and is labeled “terra ultra incognita”. The straight lines that appear as the outlones of the west coast of South America have been interpreted as Waldseemüller’s way of picturing regions for which he had no specific geographic information to make a more accurate representation. These same features, however, also appear on the modern coast when it is projected on the model projection that I am using to represent the geometry of the 1507 World Map. Waldseemüller’s representation of the continent and the re-projected outline of modern South America are strikingly similar visually.